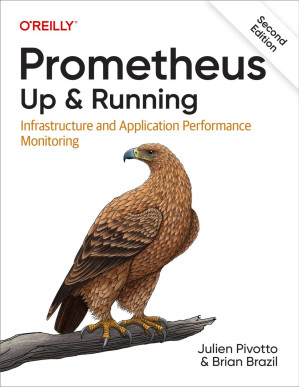
Insights from Prometheus Up & Running: Infrastructure and Application Performance Monitoring, 2nd Ed
When managing modern systems, effective monitoring can make or break your application’s reliability and performance. My own journey with monitoring tools has been one of trial and error, searching for a solution that balances simplicity and power. That’s why I picked up Prometheus: Up & Running (Second Edition) by Julien Pivotto and Brian Brazil. This book dives deep into Prometheus, an open-source, metrics-based monitoring system, which has become a cornerstone for DevOps teams worldwide. If you're curious about scaling your infrastructure monitoring or learning Prometheus from scratch, this book provides a comprehensive guide.

Summary
Part I: Introduction
Chapter 1: What is Prometheus?
This chapter introduces Prometheus as a metrics-based monitoring system focused on operational monitoring. It highlights its label-based data model, pull-based architecture, and integration capabilities with tools like Grafana and Kubernetes. It also touches on Prometheus’ origins at SoundCloud and its evolution into a Cloud Native Computing Foundation (CNCF) project.
Quote: “Prometheus does one thing, and it does it well.” – Page 3
Chapter 2: Getting Started with Prometheus
The authors guide readers through setting up a basic Prometheus environment, from downloading the software to configuring scrape targets and running PromQL queries. This chapter also introduces essential tools like the Node Exporter for gathering machine-level metrics and the Alertmanager for notifications.
Part II: Application Monitoring
Chapter 3: Instrumentation
This chapter emphasises the importance of instrumenting your applications directly. It includes examples of using Prometheus client libraries in Python to create and expose custom metrics. Readers also learn best practices for designing metrics with base units and clarity in mind.
Key Insight: Metrics should use base units (e.g., seconds, bytes) for consistency across systems.
Chapter 4: Exporting Metrics
This chapter dives into exposing metrics to Prometheus, whether through direct instrumentation or by using exporters. It explains how to transform third-party applications’ data into Prometheus-compatible metrics using exporters and service discovery configurations.
Chapter 5: PromQL Fundamentals
PromQL (Prometheus Query Language) is the centerpiece of Prometheus’ analysis capabilities. This chapter introduces its syntax and functions for creating insightful queries. Examples include calculating rates, averages, and histograms for deeper insights.
Quote: “If you can graph it, you can alert on it.” – Page 36
Chapter 6: Building Dashboards
Readers learn how to create effective dashboards using Grafana. The authors highlight best practices for grouping related metrics, creating meaningful visualizations, and using labels to organize data efficiently.
Part III: Advanced Topics
Chapter 7: Scaling Prometheus
This chapter addresses challenges that arise as monitoring demands grow, such as handling high cardinality and scaling Prometheus’ storage. Solutions include using federation and remote storage integrations.
Chapter 8: Alerting
The authors walk through setting up alerts with PromQL, managing notifications with the Alertmanager, and reducing noise through alert grouping and silencing. This chapter also explains configuring escalation paths for critical alerts.
Chapter 9: Security
This chapter covers securing Prometheus environments. Topics include enabling TLS, using authentication mechanisms, and following best practices for securing scrape endpoints and Alertmanager configurations.
Chapter 10: Ecosystem and Integrations
Prometheus’ flexibility comes from its integrations with tools like Kubernetes, OpenTelemetry, and Grafana. The chapter also discusses the role of exporters in extending Prometheus’ capabilities to third-party applications.
Key Takeaways
Key Takeaway 1: Labels Provide Flexibility
- Prometheus' label-based data model lets you analyze metrics at different levels of granularity. For instance, you can monitor HTTP requests per application or drill down to requests per data center.
- This feature simplifies multi-dimensional analysis and is invaluable in complex, distributed systems.
- Quote: “Labels convert unknowns into knowns by adding context to metrics.” – Page 20
Key Takeaway 2: Combine Metrics with Logs and Traces
- Prometheus excels at metrics but works best alongside logging tools (e.g., ELK stack) and tracing systems (e.g., Jaeger). Together, these tools provide a comprehensive view of system health.
- This resonates with the "three pillars of observability," helping diagnose issues effectively.
Key Takeaway 3: PromQL is Essential
- PromQL enables complex queries like calculating error rates or analyzing trends over time. Mastering PromQL is crucial to unlocking Prometheus' potential.
- Personal Reflection: It’s like SQL for system metrics a must-learn for DevOps engineers.
- Quote: “If you can graph it, you can alert on it.” – Page 36
Key Takeaway 4: Scalability Requires Strategy
- Scaling Prometheus involves understanding its limitations, like high-cardinality data, and employing federation or remote storage effectively.
- Personal Reflection: This takeaway reinforces that scalability isn’t just about hardware but also smart configurations.
Personal Reflections
Reading this book has reshaped how I think about monitoring. It’s not just about collecting data but understanding what matters most in your systems. The authors' emphasis on clear, actionable metrics has inspired me to improve my approach to observability.
Conclusion
Prometheus: Up & Running is an essential read for anyone involved in system monitoring or DevOps. The book’s practical approach and real-world examples make it an invaluable resource, whether you're a beginner or a seasoned pro. If you're ready to take your monitoring strategy to the next level, this book is a great place to start.