The 72-Hour Rule and UK Gas Storage: A Home Assistant Integration
You may have seen the recent UK government advice about emergencies: households should be ready to look after themselves for 72 hours. That could mean a storm, a local power cut, or some other problem with the infrastructure we all rely on.
My first reaction was: why three days? Most people think of bottled water and tinned food. But if you’ve lived through a cold British winter, you know the thing you really can’t do without is heating, and for most of us that means gas.
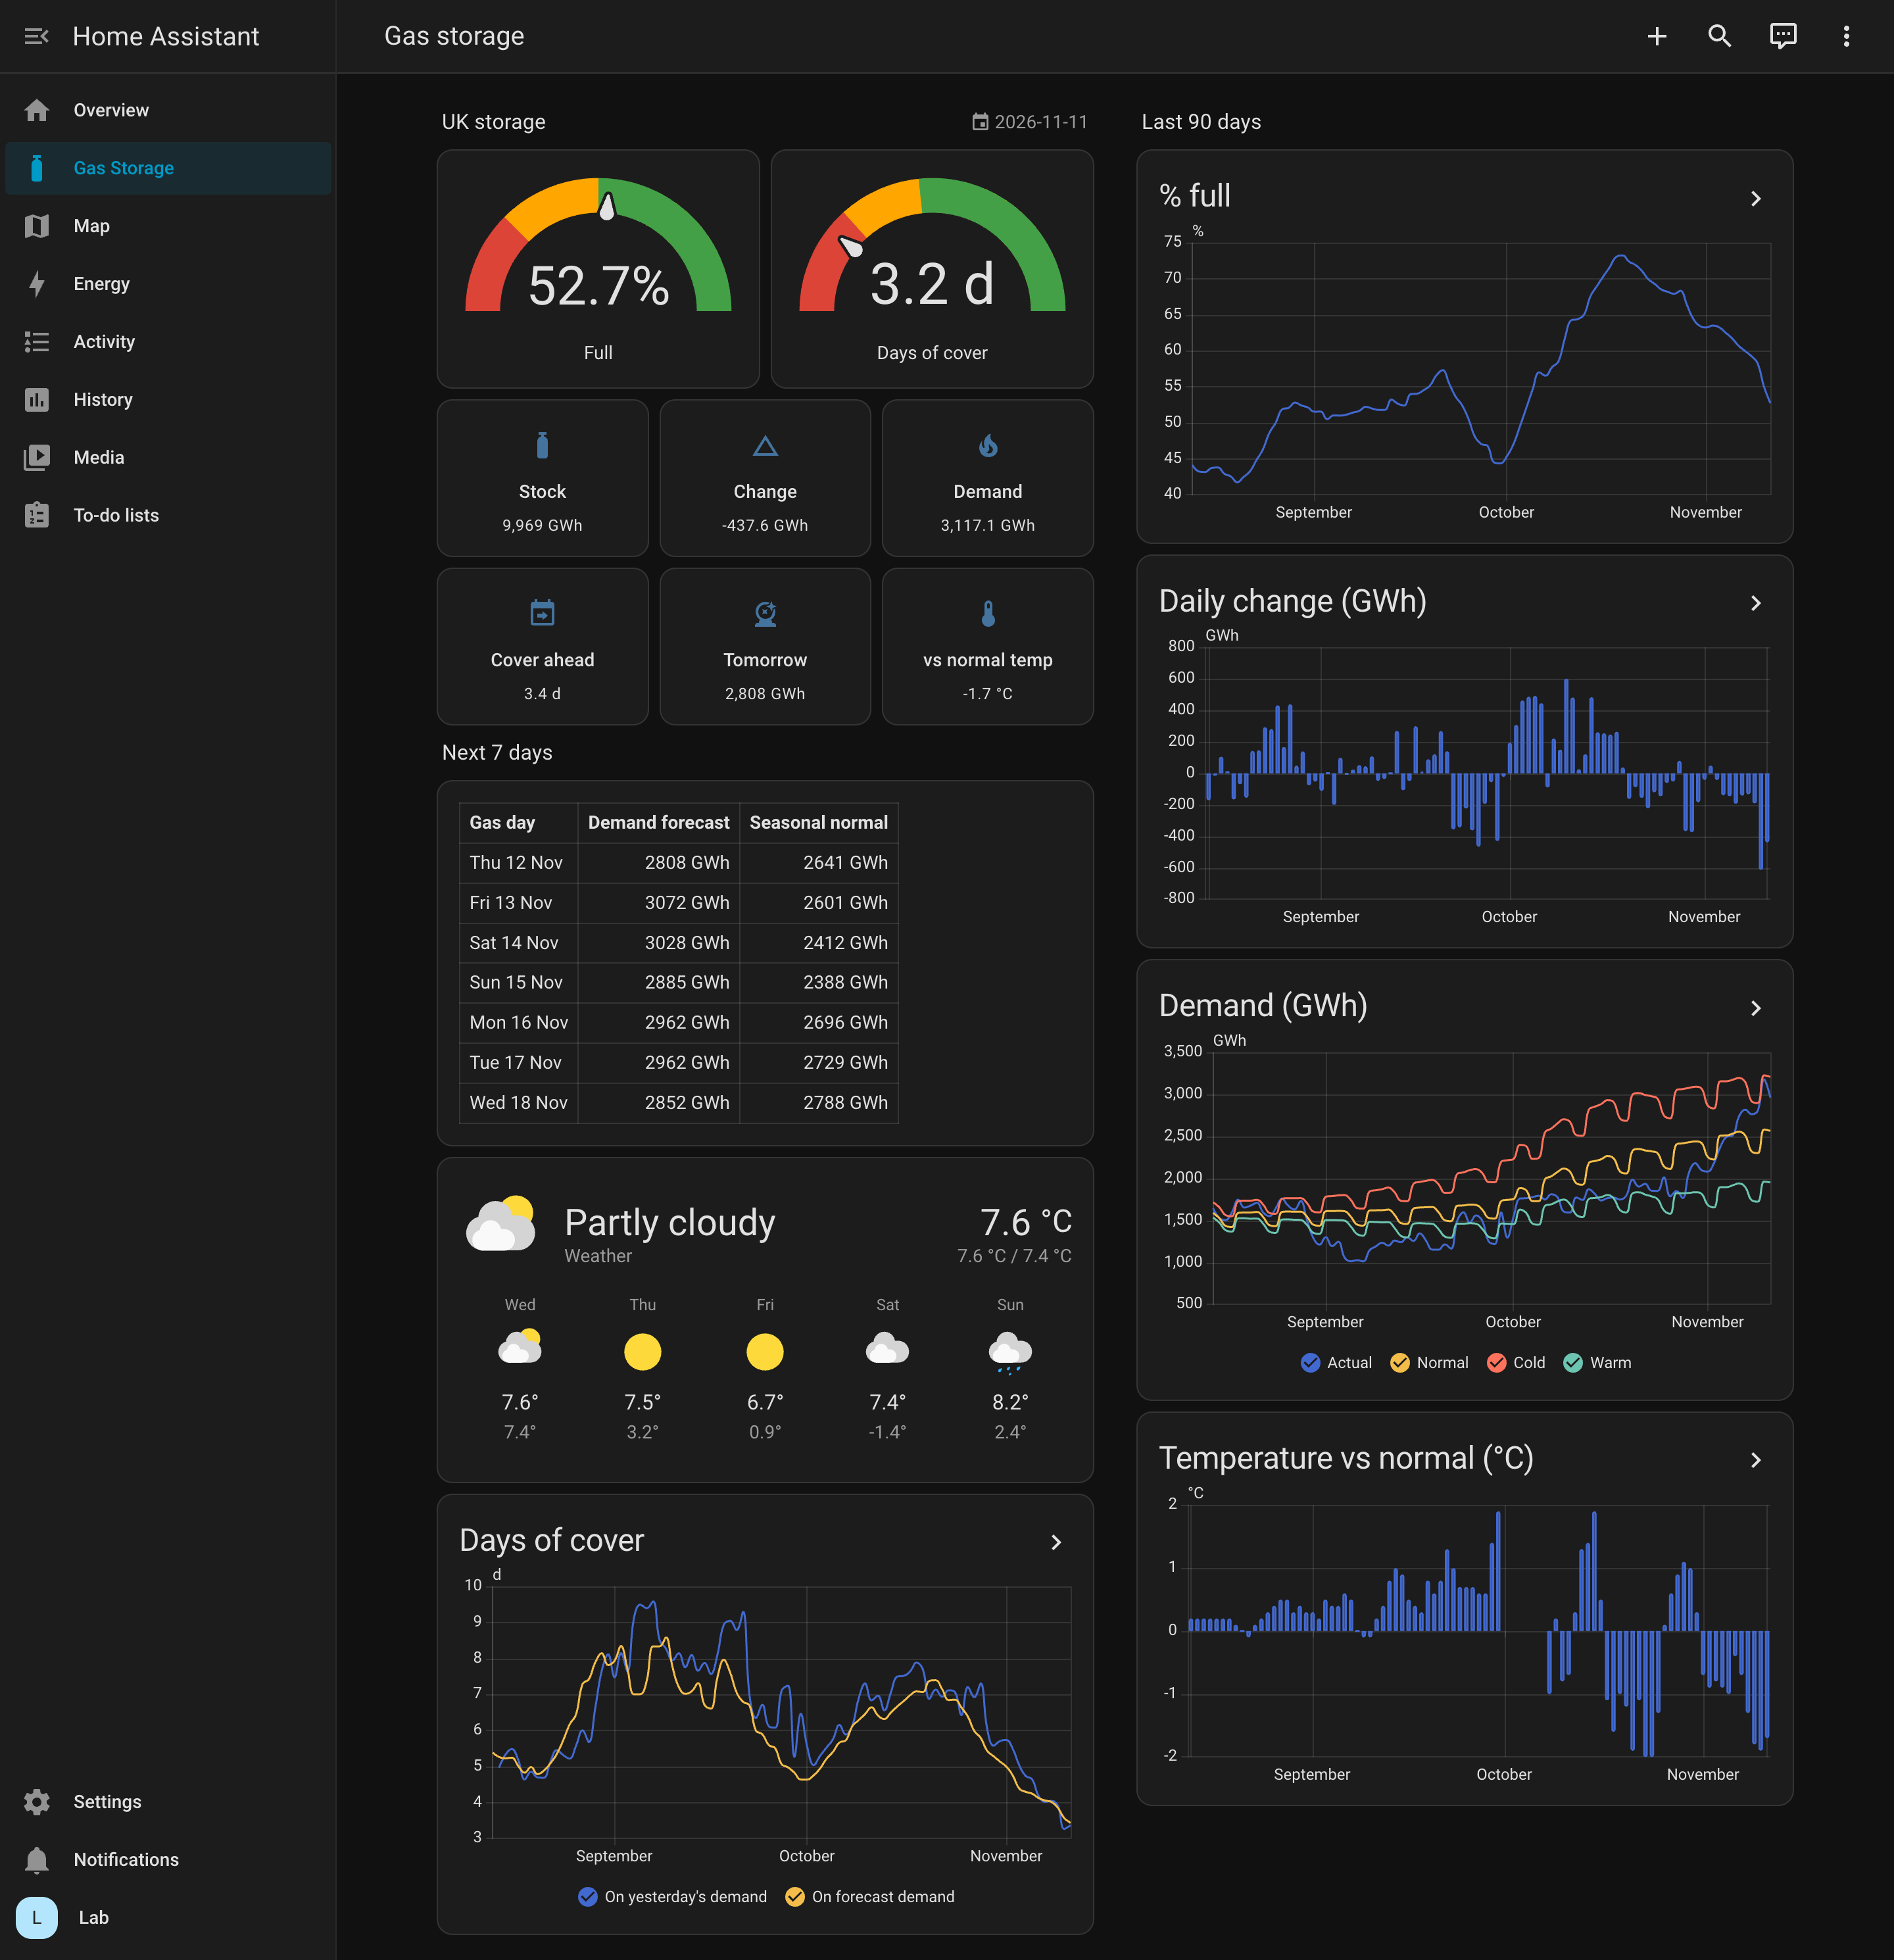
So I looked at the numbers. On a normal November day, UK gas storage was about 52.7% full, with 9,969 GWh in stock. Daily demand was 3,117.1 GWh. Divide one by the other and you get about 3.2 days of cover. That’s pretty much the same 72 hours the government is talking about.
That got me curious enough to build a small open-source project: ha-gas-storage-monitor, a Home Assistant integration that tracks UK gas storage.
Why storage matters in the UK
A lot of continental Europe has large underground storage sites that fill up in summer and get drawn down in winter. The UK has much less. We mostly rely on gas arriving as we need it: North Sea production, pipelines from Norway, and LNG shipments from around the world.
We also have very little storage to fall back on. UK storage capacity is about 5% of annual demand, compared with an EU average of around 29% (The National). About half of it is a single site, Rough, off the Yorkshire coast. Rough was shut in 2017, partly reopened in 2022 after gas prices spiked, and its owner Centrica now says it will close at the end of March 2027 unless the government agrees to support it (GB News, Yorkshire Post). The 2022 restart only brought back about a fifth of its old capacity, and Centrica’s plan to properly redevelop it is a £2bn project. It isn’t something you can switch back on in the middle of a cold winter. That’s the risk I keep coming back to.
(Rough’s status as of November 2026. This is still being decided, so check the latest news.)
The system is planned for bad winters. The government’s National Risk Assessment models “1-in-20-year” peak demand. But the margins are tight, and a few things can squeeze them:
- Low storage is slower to use. It isn’t just how much gas is stored. As storage levels drop, the rate you can pull gas out drops too.
- Cold weather pushes demand up fast. A dip of only 1.7 °C below the seasonal normal noticeably raises the national demand forecast. If that happens at the same time as a delayed LNG cargo or a pipeline problem, supply gets tight quickly.
- Fixing things takes time. When the government says 72 hours, it’s admitting that a major outage won’t be sorted out in an afternoon. Seeing the “days of cover” figure sit right around three days makes that advice feel a lot more real.
Putting the numbers in Home Assistant
I can’t do anything about LNG shipments or North Sea pipelines. But I can see the numbers, and I already have a Home Assistant dashboard I look at every day, so it made sense to put them there.
The integration pulls live UK gas storage data, a 7-day demand forecast, and 90 days of history into Home Assistant. All of it comes from National Gas’s free operational data API, the same figures National Gas publishes for the gas network. No API key needed.
Click the screenshot to see it full size.
What it shows
- Storage and days of cover: how full UK storage is (as a percentage and in GWh), the daily change, and days of cover based on yesterday’s demand and on the forecast.
- 7-day demand forecast: expected daily demand in GWh compared with the seasonal normal, plus how far the temperature is from normal.
- 90-day history: charts for % full, daily injections and withdrawals, demand (actual, normal, cold and warm scenarios), and temperature differences over the last three months.
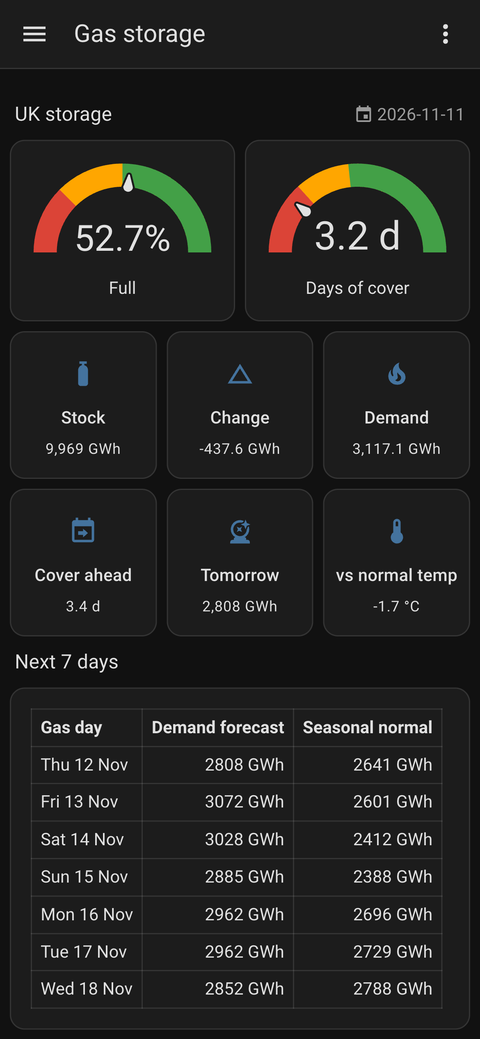
- Setup: it’s configured through the Home Assistant UI and works on mobile dashboards. If you want local weather next to the national demand figures, you can optionally link a weather entity such as Pirate Weather.
Here’s how it looks on my phone:
Wrapping up
I’m not trying to predict a disaster. I just find it useful to see the actual numbers. Watching a couple of degrees of cold weather take storage from a comfortable level down to about three days of cover made the 72-hour advice make a lot more sense to me.
If you use Home Assistant in the UK and want to keep an eye on this alongside your own energy dashboard, the code is on GitHub and you can install it through HACS: github.com/vechiato/ha-gas-storage-monitor. Let me know how you get on with it.